 d
d
The representation of spatial information, particularly as maps, creates a number of obvious problems for users who do not have access to the full range of multimedia including graphics, colour differentiation, sound, etc. In general, maps are produced from textual information that is held in databases. Currently the best that can be done for maps easily is to have them printed on a haptic printer that knows to create different tactile representations according to the changes identified, such as changes in colour. These haptic maps look to the uninitiated like 'Braille maps', and can be very useful.
In the near future, it is hoped that this situation will be vastly improved. Graphical representations, particularly those that are data-driven, can be rendered as Scalable Vector Graphics (SVG). SVG objects are, as the name implies, scalable, so that they can be enlarged without deterioration. They can have metadata associated with objects and be composed of a set of objects so that elements of the graphic can be described with metadata. This means that a composed image, such as a map of a school playground, can have its composition, and the objects used in that composition, described. Similarly, stylesheets can be attached to the objects and the relationships between them, so that audio, haptic or other representations can be generated from the data. Using Synchronised Multimedia integration Language (SMIL), voice, captions, descriptions and other representations can be attached to the objects.
Tony Hayes, an Australian, is working on making images audible by analysing the image and representing it in an auditory form. This is useful for blind people moving about the real world as well as for 'viewing' images - ir, as the name vOICe implies using a voice to achieve the "Oh, I see!" effect. See http://ourworld.compuserve.com/homepages/Peter_Meijer/voice.htm
Not all blind people can read Braille and some Brailles are different so sound maps are a good way to go. Sound is also good for dyslexic, illiterate and foreign language people. They often rely on earcons - " The system also employs "earcons," a play on the word "icons." Earcons are tone-based symbols combining pitch and rhythm that provide additional instructions for navigating around the map." Seehttp://garnet.acns.fsu.edu/~djacobso/haptic/press/press93106.html
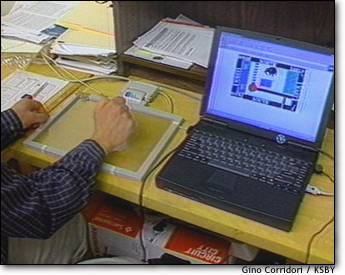
- see http://garnet.acns.fsu.edu/~djacobso/haptic/pub/hapticabstracts.html for interesting series of papers esp covering the benefits of using tactile maps when trying to learn spatial concepts and to move about in space. Note haptic maps and haptic mouse ... see image from http://garnet.acns.fsu.edu/~djacobso/haptic/press/pressksby.html "Along with the touch window, Jacobson is pioneering the use of a haptic mouse (haptic refers to the sense of touch). A haptic mouse is shaped like a conventional mouse but connects to a rod and a box. Its movement is based on a fixed frame of reference, and gives feedback to the user via effects like the feel of a washboard surface to indicate types of terrain, or a resistance that defines a "virtual" border or a wall." Seehttp://garnet.acns.fsu.edu/~djacobso/haptic/press/press93106.html
Please note: so far this image is being used without permission from the owner's. permission is being sought.website. See the original.
See article by Robinson on Speaking a global map language (local).
Last updated: 8 March 2002